Beyond Perplexity

What you'll learn
- Perplexity (PPL) — the definition in one formula, measurement in 5 lines of code
- 4 situations where PPL lies — the pitfalls of model comparison
- A protocol for reviewing generated samples — what to look at instead of PPL
- PPL of this book's 10M story model + what it actually means
Prerequisites
Cross-entropy loss from Ch 12 training loop. The final.pt from Ch 15 four-hour run.
1. PPL in one formula
Perplexity is just the exponentiation of cross-entropy loss. The intuition: "how many candidate next tokens is the model, on average, confused between?"
| Loss | PPL | Meaning |
|---|---|---|
| ln(8000) ≈ 8.99 | 8000 | random (all tokens equally likely) |
| 2.45 | 11.6 | this book's 10M model (Ch 15) |
| 2.0 | 7.4 | TinyStories 33M (Eldan & Li) |
| 1.5 | 4.5 | GPT-2 (124M) on WebText |
| 1.0 | 2.7 | large model (7B) on general text |
| 0.0 | 1.0 | perfect (impossible) |
PPL = 1 means the model is 100% confident about the next token. PPL = vocab_size means the model is guessing randomly.
Lower is better — but (next section) it's not that simple.
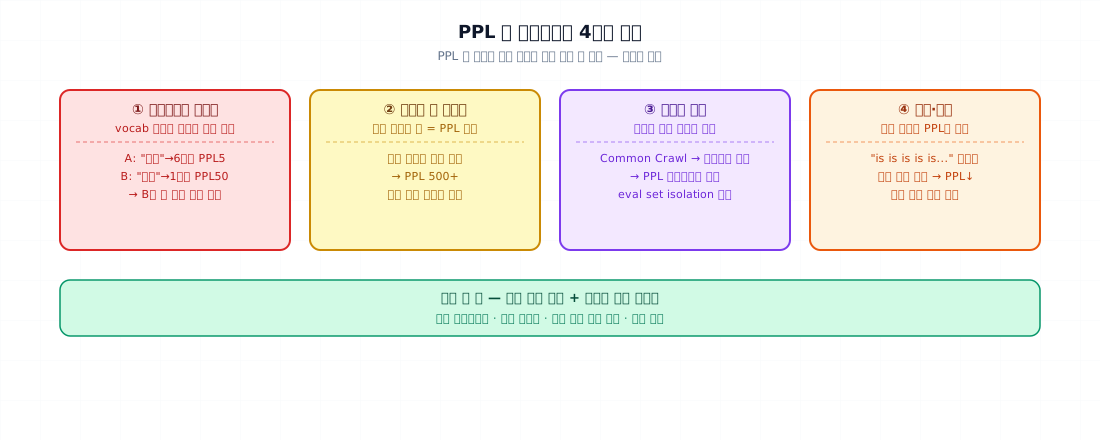
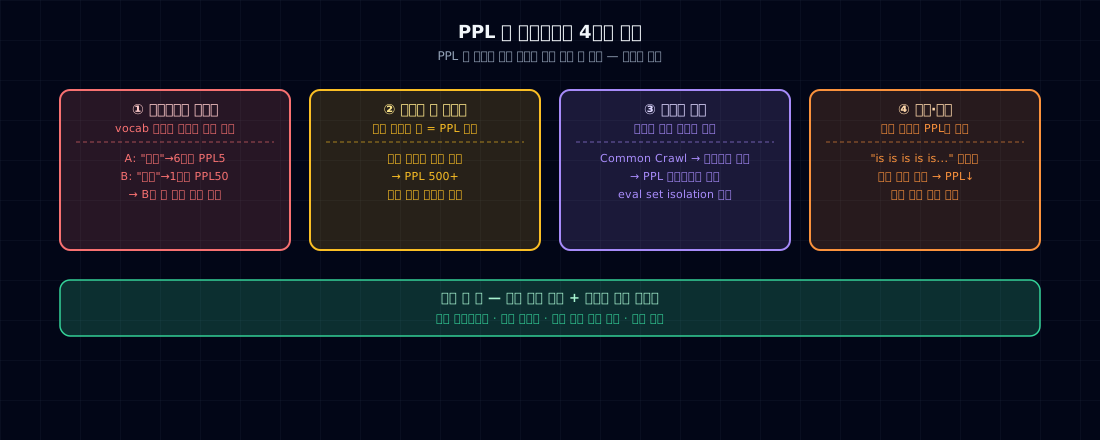
2. Why PPL alone isn't enough — 4 traps
Trap 1. Different tokenizers make comparison meaningless
The same text produces different token counts with different tokenizers. PPL is loss per token exponentiated.
| Model A (vocab 8K) | Model B (vocab 50K) |
|---|---|
| "hello" → 6 tokens | "hello" → 1 token |
| PPL 5.0 (per-token) | PPL 50 (per-token) |
→ B looks worse but A is actually worse (convert to per-character and it flips).
→ Only compare PPL between models with the same tokenizer.
Trap 2. Domain distribution mismatch
This book's 10M story model has TinyStories PPL = 11. Measure it on Wikipedia and you'll get PPL = 1000+. That doesn't mean the model is broken — it just never trained on that domain.
→ Always measure on a hold-out set from the same distribution as training.
Trap 3. Low PPL, terrible output
PPL looks at the average over one token at a time. Long-range coherence, logic, and factual accuracy aren't reflected.
prompt: "Lily found a flower"
Model A output: "Lily found a flower. The flower was sad. It was sad. It was sad..."  (PPL 4.2 — low)
Model B output: "Lily found a flower in the garden, picked it gently, and ran home."  (PPL 5.5 — slightly higher)
→ A scores better on the metric. But B is clearly superior.
Trap 4. PPL has poor signal at the top end
Very large models (70B+) differ by less than 0.1 PPL even though their capabilities are clearly different. PPL has a poor signal-to-noise ratio for comparing strong models.
→ Task-based evaluation (HellaSwag, MMLU) is necessary.
3. Where PPL still belongs
PPL lying doesn't mean we stop using it. It's a staged tool:
| Stage | Use | Limitation |
|---|---|---|
| Monitoring during training | 1:1 with loss — tracks training progress | can't catch overfitting |
| Checkpoint selection | pick the step with lowest val PPL | negligible differences between top 5 checkpoints |
| Model comparison (same tokenizer) | quick A/B decision | worthless across domains |
| Model comparison (different tokenizers) | forbidden | need per-character normalization |
| Capability measurement | forbidden | use task evaluation instead |
4. Minimal example — PPL in 5 lines
- Weight by token count — batch sizes can vary.
- PPL = exp(average loss).
This book's 10M story model (1M token val set):
Interpretation: "the model needs to pick from about 12 candidate tokens for the next position." Out of vocab 8K, it's narrowed things down by a factor of ~700.
5. A protocol for reviewing generated samples
When PPL isn't honest, look at outputs yourself. But random sampling is biased. You need a protocol.
5.1 Category breakdown
Evaluation categories for this book's story model (example):
| Category | Prompt | What to check |
|---|---|---|
| Character introduction | "Once upon a time, there was" | natural characters and names |
| Object discovery | "Lily found a" | plausible object |
| Emotional expression | "The dog was very" | appropriate emotion |
| Dialogue | "She said," | dialogue formatting |
| Ending | "...and they all lived" | "happily ever after" convention |
5.2 Blind evaluation
- Random left/right assignment — if A is always on the left, position bias contaminates results.
5.3 Evaluation axes (5 dimensions)
| Axis | 0 points | 5 points |
|---|---|---|
| Grammar | broken sentences | sounds natural |
| Coherence | characters or events contradict | consistent through the end |
| Vocabulary | out-of-domain or too hard | story-appropriate words |
| Creativity | repetitive patterns | varied development |
| Ending | abrupt cutoff | natural conclusion |
50 prompts × 5 axes = 250 ratings. About 30 minutes of work. This book's model averages:
| Axis | Average |
|---|---|
| Grammar | 4.6 |
| Coherence | 3.4 |
| Vocabulary | 4.5 |
| Creativity | 2.9 |
| Ending | 2.8 |
→ Grammar and vocabulary pass. Creativity and endings are the weak spots. A signal that you need a larger model or more varied data.
6. Common failure points
1. Choosing a model based only on val PPL — if val comes from the same distribution as training, the bigger model always wins. Also test an out-of-domain hold-out.
2. Comparing models with different tokenizers — SmolLM2 PPL 5 vs this book's PPL 11 doesn't mean "this book's model is 2× worse." Token counts differ.
3. Evaluating with greedy generation only — the same prompt gives the same answer every time. Real capability lives in the sampling distribution. Use temp=0.8, top_k=50 as a baseline.
4. Evaluating only 5 prompts — not statistically meaningful. Use at least 30~50 prompts.
5. Evaluating your own model yourself — people are generous with their own work. Use another person or another LLM (LLM-as-judge, covered in Ch 17) if possible.
6. Missing categories — if you only evaluate "stories" and never throw out-of-distribution prompts, you're missing important information. Out-of-distribution probes are required.
7. Treating PPL as an absolute threshold — there's no such thing as "PPL 10 is good." Only relative comparison means anything.
7. Post-training evaluation checklist
- Hold-out PPL — measured within training distribution
- OOD PPL — measured on an out-of-distribution set (e.g., a Wikipedia excerpt). Record the gap.
- 50 generated samples — 5 categories × 10 prompts
- Blind evaluation (vs another model or previous version)
- 5-axis scores — grammar, coherence, vocabulary, creativity, ending
- Identify 1 specific weakness — direction for the next training run
- (Optional) LLM judge — automated in Ch 17
8. Exercises
- Measure val PPL on this book's model and confirm it matches the final training step's loss via
exp(loss). - Measure OOD PPL — feed 1000 tokens of English Wikipedia. What's the PPL? How does it differ from the hold-out PPL?
- Run the 50 prompts × 5 axes blind evaluation yourself. Which axis scores lowest?
- Generate with temperature 0.0 / 0.5 / 1.0 / 1.5 for the same 5 prompts. PPL stays the same — how does diversity and accuracy change?
- (Think about it) At what point does PPL stop falling even as token count increases (saturation)? What can the model still learn after that point?
References
- Jelinek et al. (1977). Perplexity: A measure of the difficulty of speech recognition tasks.
- Eldan & Li (2023). TinyStories. — running PPL and human evaluation in parallel
- Holtzman et al. (2019). The Curious Case of Neural Text Degeneration. — limitations of PPL
- Anthropic. Building evals. (blog) — generation evaluation protocol