Ch 27. Observability in Production¶

What you'll learn
- Three signals of observability — logs, metrics, traces — why you need all three
- Trace spans to decompose a single request — see what fraction goes to LLM calls
- Structured logging + consistent
trace_idpropagation - Connecting to LangSmith / Langfuse / OpenTelemetry
- Prompt version registry + A/B rollouts
- Six critical pitfalls (logs alone aren't observability · secrets in traces · single metric blindness · cardinality explosion · sampling bias · unmanaged prompt versions)
Prerequisites
The 5-layer architecture from Ch 26. You must be able to trace guardrails (Ch 28) and human escalations (Ch 29) in one line of telemetry.
1. Concept — Three signals, or don't operate¶
PoC observability is usually print(). Production demands more.
Logs "what happened?" · Metrics "how often/fast?" · Traces "where to where?"
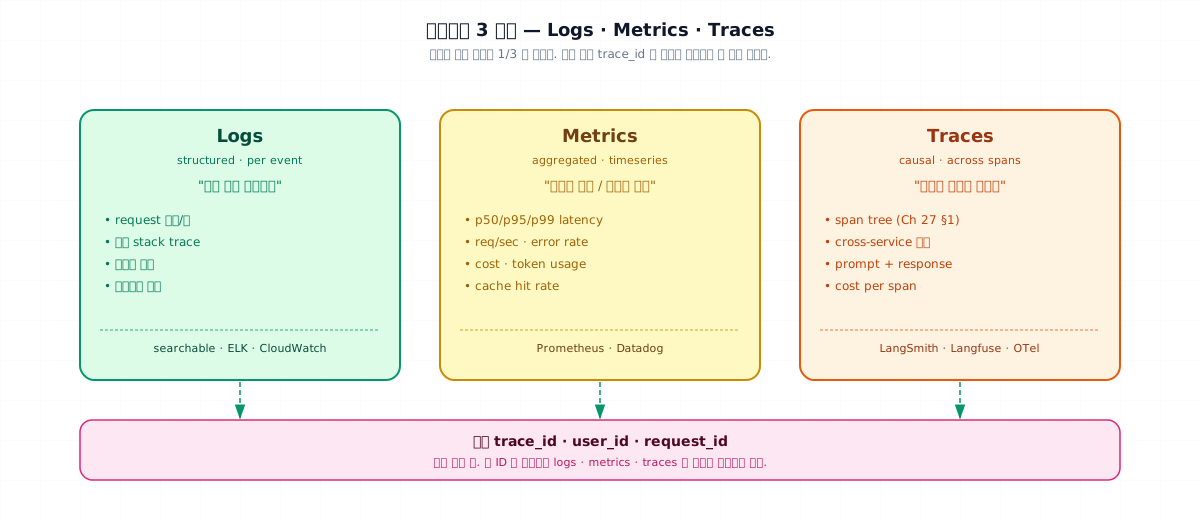
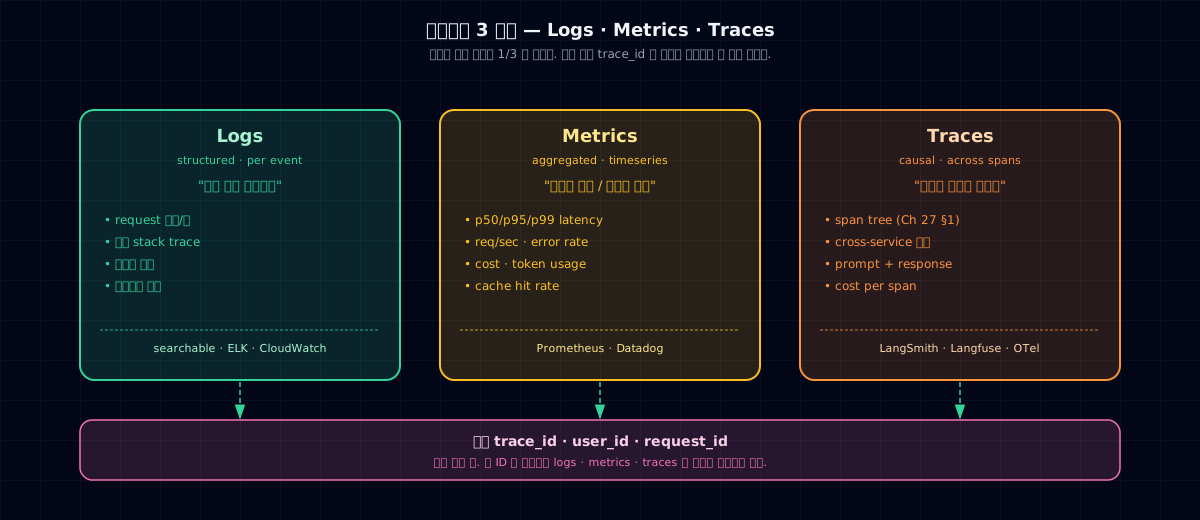
| Signal | Unit | Tools | Answers |
|---|---|---|---|
| Logs | event | ELK · CloudWatch · Loki | "Exactly what landed for this user" |
| Metrics | timeseries | Prometheus · Datadog | "Average latency in the last hour vs. baseline" |
| Traces | span tree | LangSmith · Langfuse · OTel | "Which step consumed all the time and money" |
The core trick is tying all three to the same key. When trace_id · user_id · request_id appear in every signal, a single search pulls logs, metrics, and traces together. Otherwise, when a user complains, you're stuck guessing what happened.
2. Why you need all three — one signal sees only 1/3¶
Logs only: You know an error happened, but not how often. One affected user? Acknowledge it. Ten thousand? P0 incident. Without metrics, you can't tell.
Metrics only: "p95 spiked to 5 seconds" is clear, but which user, which step? Without traces, debugging has no starting point.
Traces only: One request is visible, but system-wide trends aren't. Metrics are how you measure SLOs.
All three connected by trace_id gives you: user complaint → search trace_id → logs + metrics + span tree together → root cause in 5 minutes.
3. Where to start — the trace waterfall¶
Your first artifact: a single-request trace waterfall.
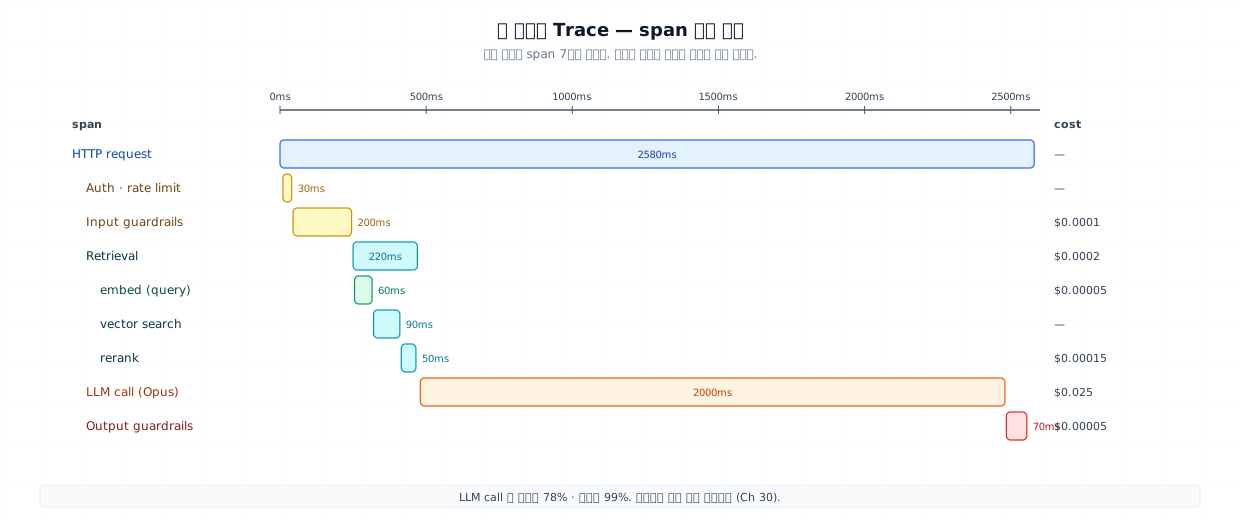
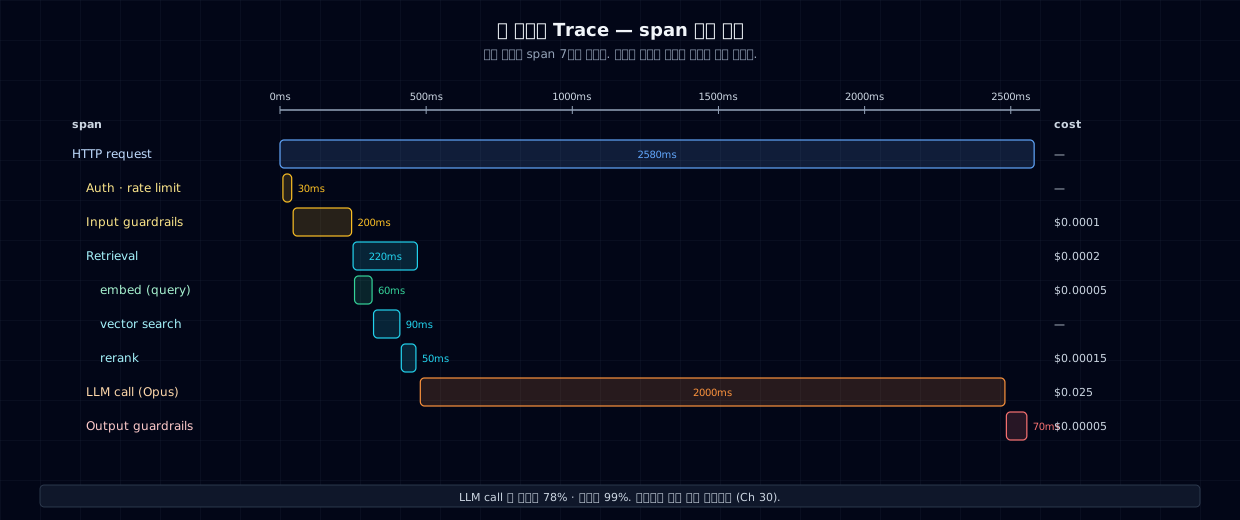
| span | latency | cost | notes |
|---|---|---|---|
| HTTP request | 2580ms | — | total |
| Auth · rate limit | 30ms | — | gateway |
| Input guardrails | 200ms | $0.0001 | Haiku classifier |
| Retrieval (total) | 220ms | $0.0002 | 3 sub-spans below |
| ↳ embed query | 60ms | $0.00005 | |
| ↳ vector search | 90ms | — | Chroma |
| ↳ rerank | 50ms | $0.00015 | Cohere |
| LLM call (Opus) | 2000ms | $0.025 | 78% time · 99% cost |
| Output guardrails | 70ms | $0.00005 |
One table tells your optimization roadmap instantly — if LLM calls are thick, jump to Ch 30 (caching, routing). If retrieval is thick, jump to Ch 12 (reranking, cached chunks).
4. Minimal example — Langfuse in a line and structured logs¶
Langfuse one-liner tracing¶
- Reads
LANGFUSE_*environment variables and sends automatically. Self-hosted option available. - The
@observedecorator creates a span automatically. Input, output, token count, cost, and latency are captured together.
Structured logging — one JSON line¶
contextvarspropagatestrace_idthrough async handlers without manual threading. Set once in your FastAPI middleware.
Metrics — Prometheus counters and histograms¶
from prometheus_client import Counter, Histogram
LLM_CALLS = Counter("llm_calls_total", "LLM calls", ["model", "status"])
LLM_LATENCY = Histogram("llm_latency_seconds", "LLM latency", ["model"])

# In your handler
LLM_CALLS.labels(model=model, status="ok").inc()
LLM_LATENCY.labels(model=model).observe(elapsed)
Never put user_id in metric labels — cardinality explosion kills the metrics database. Keep user_id in traces only.
5. Production — Prompt registry and A/B rollouts¶
The classic production mishap: tweak a prompt, break everything. Defense: version control.
A/B rollout:
- Roll out v2 to 10% first. Once
prompt_keyis in traces, use Langfuse to compare v1/v2 scores, latency, and cost side-by-side (pairs with Ch 17 LLM-as-Judge evaluation).
Golden signals¶
| Metric | Target | Alert threshold |
|---|---|---|
| Latency p95 | < 3.5s | p95 > 5s for 5 min |
| Error rate | < 1% | avg > 3% over 5 min |
| Cost per request | < $0.05 | daily avg > $0.08 |
| Cache hit rate | > 30% | < 10% (suspect broken keys) |
| Guardrail trigger rate | < 5% | > 15% (suspect false positives) |
| Approval queue depth | < 50 | > 200 (team overload) |
| Eval score (online) | > baseline | 5pt drop from baseline |
Pick 3–4 of these for your SLO. Too many and none get met.
6. Common pitfalls¶
- Thinking logs = observability. Logs capture known events. Trends and causation require metrics and traces.
- Shipping secrets in traces. API keys, tokens, user passwords end up plaintext in Langfuse. Redact middleware is mandatory (regex + same PII patterns as Ch 28 guardrails).
- High-cardinality label explosion.
Counter(..., labels=["user_id"])kills the metrics DB with cardinality OOM. Labels must be enums (model, status, region only). - Single metric blindness. p95 alone misses p99 incidents. Track p50/p95/p99 + error rate + cost on the same dashboard.
- Sampling bias. 1% trace sampling misses rare errors. Use tail sampling: 100% on errors, 1–10% on success.
- No prompt versioning. No one knows who changed what when. Regressions are untrackable. Use registry + git tags + trace injection.
- Alerts go to Slack only. Midnight P0 gets buried. Separate escalation policy (Slack → PagerDuty → oncall).
- One shared metrics dashboard. Everyone sees it, no one owns it. One dashboard = one owner.
7. Operations checklist¶
-
trace_idinjected into every log, metric, and trace - Secrets redaction middleware (before Langfuse sends)
- Metric label cardinality enforced (no
user_id) - Base dashboard: p50/p95/p99 latency · error rate · cost
- Tail sampling — 100% on errors, 1–10% on success
- Prompt registry + A/B rollout +
prompt_keyin traces - SLO narrowed to 3–4 metrics with alerting
- Each dashboard has one owner
- Alert escalation (Slack → PagerDuty → on-call)
- Online eval score tracking — automated regression detection
- Data retention policy — logs 30d · traces 7d · audit 7y (Ch 29)
8. Exercises¶
- Design a 7-step procedure to narrow down a user complaint ("the answer looks wrong") to root cause in 5 minutes using only
trace_id. - Look at the trace waterfall in §3. Identify the first optimization target and justify it. (Hint: you're previewing Ch 30.)
- Design a phased gate to roll out prompt v2 from 10% → 100% (specify metrics, thresholds, duration between phases).
- You just discovered a metric label has
user_idin it. Write the 3-step response: immediate fix · backfill cleanup · prevent recurrence.
Next → Ch 30. Cost and Latency Optimization Now that you can see where time and money go, the next chapter shows how to cut both.
Sources¶
- Distributed Systems Observability — Cindy Sridharan (the three-signals definition)
- Google SRE Book — Monitoring Distributed Systems (golden signals · SLOs)
- Langfuse · LangSmith official docs (LLM-specific tracing)
- OpenTelemetry — Semantic Conventions for Generative AI (2024+)
- Prometheus — best practices on label cardinality