Ch 30. Cost & Latency Optimization¶

What you'll learn
- Four levers — Prompt cache · Model routing · Batch API · Context compression
- Real cost savings for each lever (varies by domain; don't assume)
- Anthropic prompt caching — 5-min TTL · 90% input cost discount
- Model router — Haiku / Sonnet / Opus three tiers · classifier cost vs. savings
- Batch API — 50% discount for async workloads
- Context compression — history summarization ·
max_tokenscontrol - Six failure modes (cache-key instability · router misclassification · batching on sync paths · information loss from compression · measuring after, not before · no A/B testing)
- Part 6 wrap-up — five operational readiness artifacts
Prerequisites
You've read Ch 27 and watched the trace waterfall. You know what's thick — if LLM calls are 78% of time and 99% of cost, that's where you cut.
1. Concept — Measure first, guess never¶
Cost and latency optimization fails the moment you start guessing. Traces and metrics come first. Hypothesis second. Implementation third. Measurement always.
"Premature optimization is the root of all evil." — Knuth
In the LLM era: don't cache before you have traces. You'll optimize things that don't matter and your code gets messy.
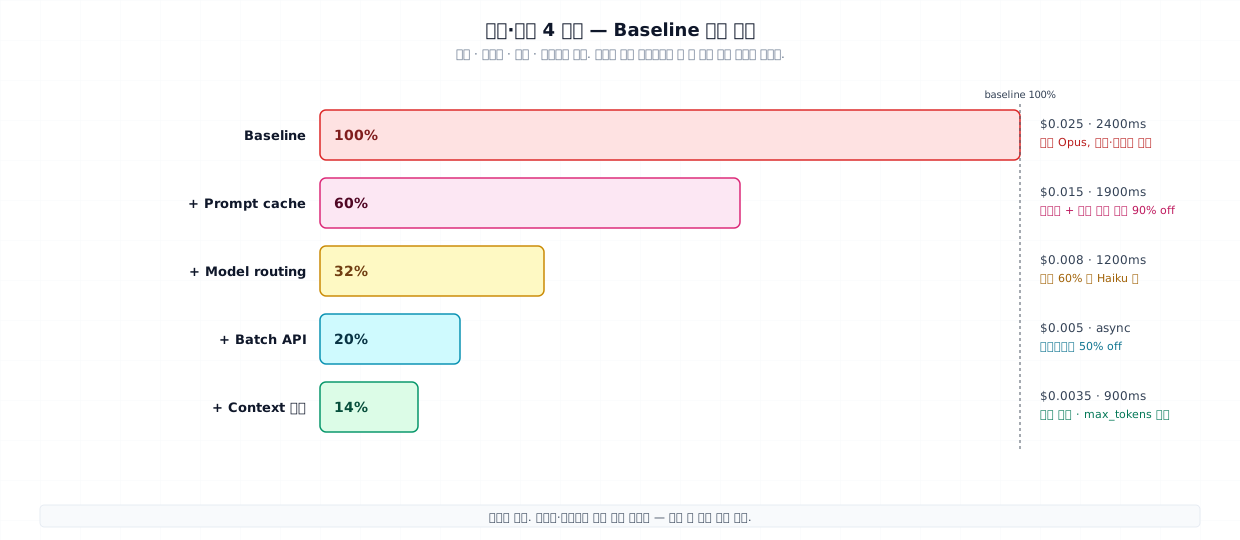
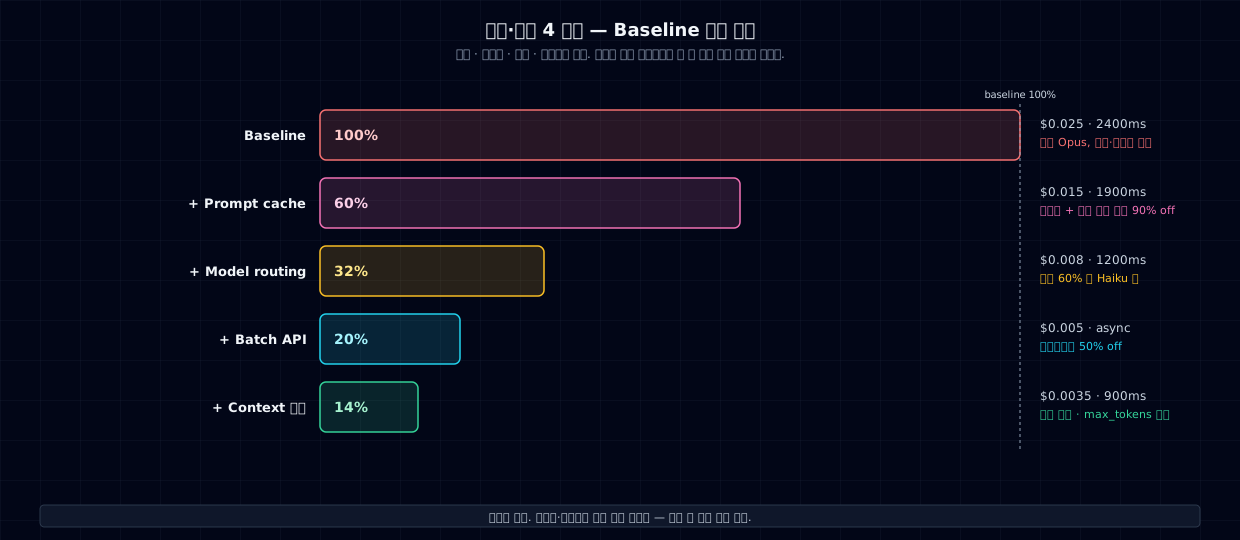
| Lever | What you're optimizing | Typical savings | Risk |
|---|---|---|---|
| ① Prompt cache | Static prefixes (system prompt, tool definitions) | −40–50% input cost | Cache key breaks → 0% hit rate |
| ② Model routing | Route ~60% of queries to Haiku | −50–70% average cost | Misclassification hurts quality |
| ③ Batch API | Async workloads (not real-time) | −50% cost | Latency (minutes to hours) |
| ④ Context compression | Long conversations, document context | −30–70% input tokens | Information loss |
These numbers are ballpark. One lever usually cuts your costs in half. You don't need all four.
2. Why it matters — The 10x trap¶
At PoC, one request costs $0.025. A thousand calls a day is $25/day, or $750/month. You can live with that.
Then traffic hits 10x. Now it's $7,500/month. At 100x, it's $75,000/month. If your unit economics don't improve, margins turn negative. More companies than you'd think are running at a loss because they didn't optimize early.
Latency works the same way. If p95 is 5 seconds, user drop-off climbs in steps (see Ch 7's TTFT discussion). For chat, sub-second first token is the breakpoint.
3. Where each lever applies¶
| Workload | First choice | Second |
|---|---|---|
| Internal chatbot (static system prompt) | ① Prompt cache | ② Routing |
| General chat (per-user context) | ② Routing | ④ Context compression |
| Batch document classification at night | ③ Batch API | ② Routing |
| Long-running conversation assistant | ④ Context compression | ① Cache |
| Code review bot (system + large guidelines) | ① Cache | ② Routing |
| Real-time search RAG | ② Routing | ① Cache (tool defs) |
4. Minimal examples — One line each¶
① Anthropic Prompt Caching¶
- Everything before the
cache_controlblock gets cached as a unit. If your system prompt is 5–10k tokens, the savings are real. - Tool definitions cache automatically if they're static. Adding or removing a tool breaks the cache key.
TTL is 5 minutes. Your next call has to land within that window to hit. Sparse traffic = smaller wins.
② Model Router¶
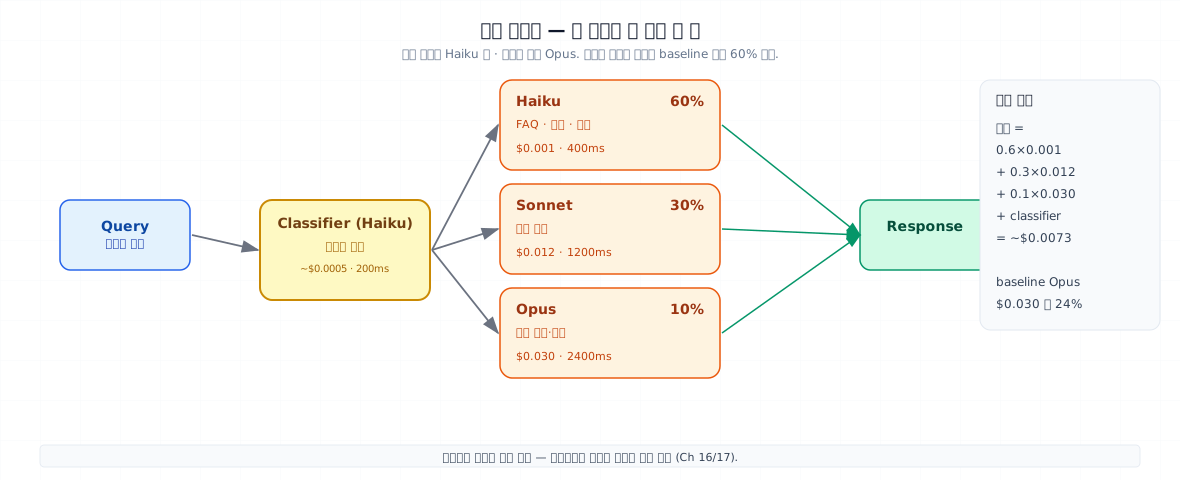
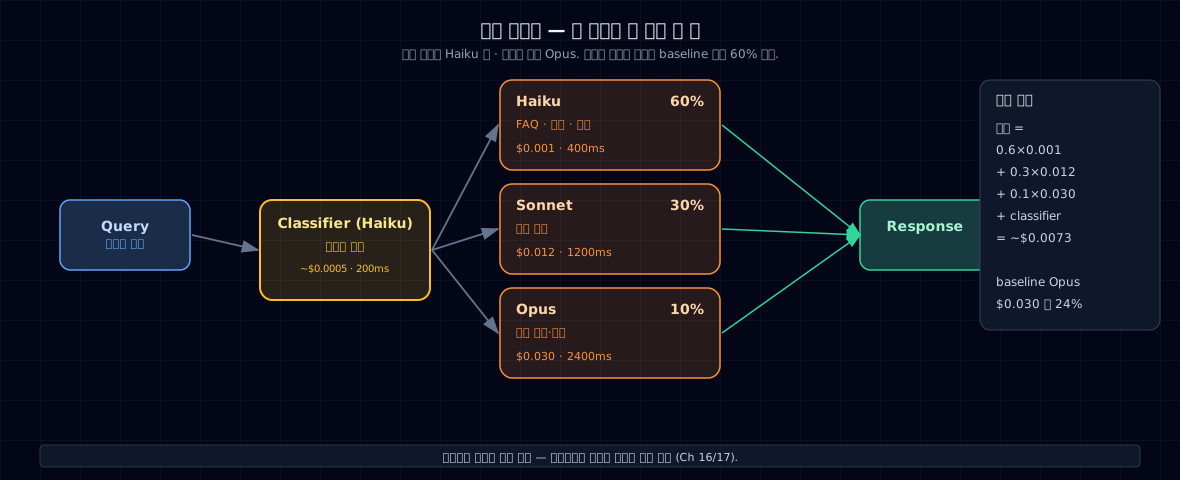
Typical breakdown (60% Haiku · 30% Sonnet · 10% Opus) ≈ $0.0073/call. Baseline Opus is $0.030. That's 24% of the cost.
Key insight: the classifier itself costs too (~$0.0005). Only route if the classifier is 10x cheaper than what you'd normally call. And measure routing accuracy separately in your eval set (Ch 16) — misclassification tanks quality.
③ Batch API¶
# Anthropic Message Batches · OpenAI Batch · 50% discount
batch = client.messages.batches.create(requests=[
    {"custom_id": f"job-{i}", "params": {"model": "...", "messages": [...]}}
    for i in range(1000)
])
# Responses land in minutes to 24 hours. Use polling or webhooks.
Async workloads only: overnight classification, summarization, embedding index updates, auto-grading. Never for user-facing chat.
④ Context Compression — Summarize history¶
async def compress_history(history: list[dict], keep_last_n: int = 4) -> list[dict]:
    if len(history) <= keep_last_n + 2:
        return history
    older = history[:-keep_last_n]
    summary = await call_llm("claude-haiku-4-5", [{
        "role": "user",
        "content": f"Summarize this conversation in ≤5 bullet points (facts only):\n\n{render(older)}"
    }])
    return [{"role": "system", "content": f"Earlier conversation summary:\n{summary}"}] + history[-keep_last_n:]
Prevents input token explosion in long conversations. Downside: summaries lose detail. Use memory (Ch 24) for facts you can't afford to lose (user name, preferences).
Other techniques:
- Cap
max_tokensto a reasonable limit — Opus doesn't need 2000 tokens of output if 500 is enough. - Trim system prompt — Remove instructions you're not using.
- Reduce few-shot examples (Ch 5).
5. Hands-on — Apply in order, measure as you go¶
Application order:
- Identify the thick bar in your trace waterfall (Ch 27).
- Pick one lever. Deploy with A/B testing (same pattern as Ch 27 §5).
- Watch seven metrics (latency p95, cost/req, eval score, etc.) for regressions.
- Zero regressions? Roll out to 100%. Move to the next lever.
- If eval score drops, rollback immediately.
Cumulative effect (example):
| Stage | Avg cost | p95 latency | Eval score |
|---|---|---|---|
| Baseline (Opus only) | $0.025 | 2400ms | 8.4 |
| + Prompt cache | $0.015 | 1900ms | 8.4 |
| + Model routing | $0.008 | 1200ms | 8.2 (−0.2) |
| + max_tokens cap | $0.007 | 1000ms | 8.2 |
Trade-off decision: Is a 0.2-point eval drop worth 70% cost savings? That's a product call. Don't optimize for cost alone.
Cost dashboard¶
| Panel | What to measure |
|---|---|
| Cost / day | Daily spend trend |
| Cost / request (by model) | Haiku / Sonnet / Opus split |
| Cache hit rate | Prompt cache · LLM cache breakdown |
| Token usage histogram | Input / output asymmetry (catch surprises) |
| Router decision mix | Easy / Med / Hard ratio (catch drift) |
| p50 / p95 latency by model | SLO per tier |
Caching stability — Prefix instability¶
The #1 cache mistake: dynamic values inside the cached block (current timestamp, user name). Every call gets a different prefix → 0% hit rate.
Rule: Everything before the cache_control block must be 100% deterministic. Dynamic values go in the user message or a separate block.
6. Common failure modes¶
- Cache key breaks. Timestamp · UUID · username in system prompt → hit rate 0%. Watch cache hit metrics like a hawk. Hit rate drops to 0? Debug immediately.
- Router misclassifies. Sends HARD queries to Haiku → quality tanks. Build a separate eval set for routing accuracy. Monitor weekly.
- Batching on the sync path. User waits for minutes. Never batch user-facing requests.
- Compression loses information. User says "My name is Alice" → summary drops it → bot forgets next turn. Keep memory (Ch 24) separate from compression.
- You measure after you deploy. Set baselines first. A/B before you roll out.
- Four levers at once. Which one broke? You can't tell. Change one at a time.
- max_tokens too tight. Answer gets cut off → users complain. Add a "truncation rate" metric to your eval.
- Provider pricing changes every quarter. Your cost model stales. Auto-sync or quarterly review.
7. Operational checklist¶
- Thickest bar in trace waterfall is priority #1
- Prompt cache's
cache_controlblock prefix is 100% deterministic - Cache hit rate monitored daily (target >30%)
- Router accuracy in a separate eval set
- Router decision mix metric tracks drift
- Batch API only on async, non-user-facing jobs
- Context compression separate from memory (Ch 24), with loss risk flagged
-
max_tokenscapped with truncation-rate metric - A/B test + eval score gate before rollout
- Cost dashboard: six panels (see §5)
- Provider pricing auto-synced or quarterly-reviewed
- Cost alerts (daily limit + 2x yesterday = page on-call)
8. Exercises & Part 6 wrap-up¶
- You have Ch 27's trace waterfall: LLM is 78% of time, 99% of cost. Which two levers do you apply first? Why?
- Your system prompt has "Today is {today}" hardcoded. Cache hit is 0%. Redesign it so cache works without breaking.
- You're building a 100-item routing eval set. What Easy/Med/Hard split do you use? Write one labeling rule for each tier.
- Identify three async workloads in your product where Batch API's 50% discount applies.
Part 6 wrap-up — Five operational readiness artifacts¶
By the end of Part 6's five chapters, you should have:
| # | Artifact | From chapter |
|---|---|---|
| ① | 5-layer architecture doc + diagram | Ch 26 |
| ② | Trace + three-signal dashboard (single trace_id linking all three) | Ch 27 |
| ③ | Seven-guardrail checklist + violation response policies | Ch 28 |
| ④ | Approval queue + audit log (wired to LangGraph interrupts) | Ch 29 |
| ⑤ | Cost–latency lever log + regression gates | Ch 30 |
With these five in hand, you're ready for:
- Part 7: Models & fine-tuning (you'll discover you need a smaller model — that's where fine-tune lives)
- Capstone: Self-Improving Assistant (all of Parts 1–6 in one system)
Next → Part 7 Models & Fine-Tuning
Sources¶
- Anthropic — Prompt Caching documentation (2024)
- Anthropic — Message Batches API documentation
- OpenAI — Batch API documentation
- Designing Data-Intensive Applications — cost–latency trade-offs (general theory)
- Google SRE — The Site Reliability Workbook (capacity planning · cost modeling)